Balint Stewart
Data scientist building tools for research data infrastructure
Combining data science and rigorous evaluation to turn fragmented records of research activity into trustworthy evidence for funders, data services and the public.
The problem
Public registers of sensitive data use are essential for transparency, but the information is usually hidden in static Excel files. This makes it difficult to see what research is being done using different kinds of data. Without a clear view of activity it’s difficult for researchers to discover precedent, funders to invest strategically, and for anyone who wants to communicate to the public about how their data is being used for public benefit.
The dashboard
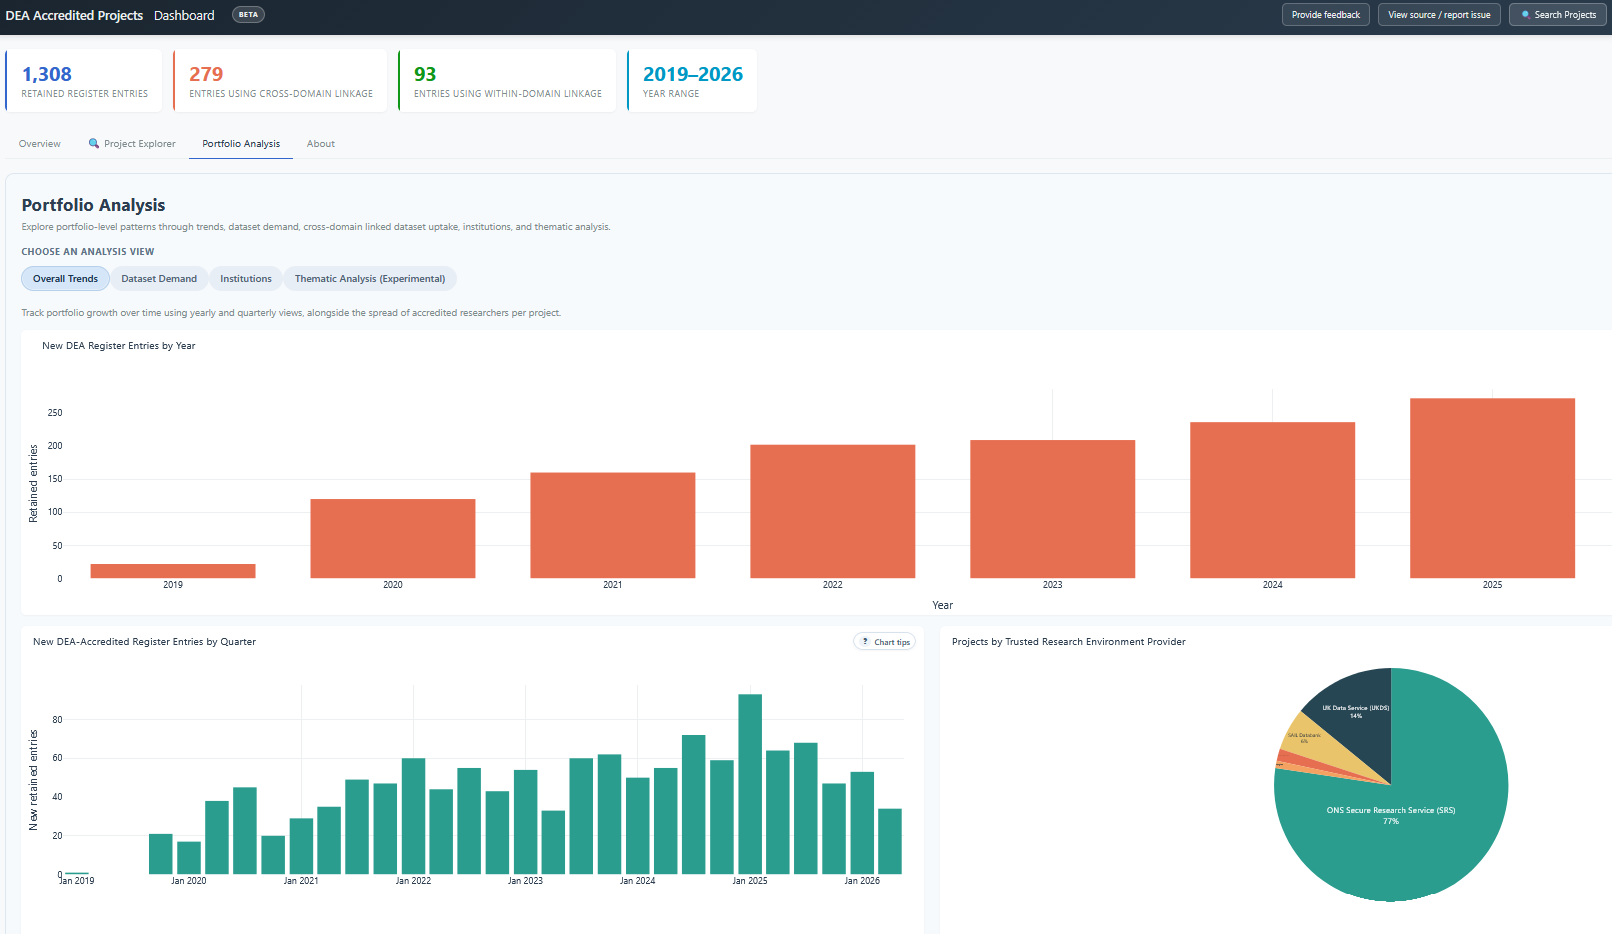
I created a live public dashboard that makes over 1300 research projects accredited under the Digital Economy Act visible and searchable. The dashboard is enriched using a large language model (LLM) to classify projects by what topic they focus on and for what analytical purpose. Visualisations use information directly from the register, as well as these LLM-classifications, to show how research activity is changing over time. For example, the classifications reveal the rapid rise and subsequent fall in COVID-19-related research projects since 2020, while research examining demographic disparities has persisted.
The challenge
The biggest challenge for applied AI in trust-critical domains like sensitive data research is in evaluation. While it’s relatively straightforward to use powerful models like LLMs to classify projects, it is much harder to distinguish between trustworthy model outputs and outputs that are confidently wrong.
Underway
A validation study for the DEA project classification is currently underway, using trained human coders to measure agreement between the model and human judgement. The study is carefully designed to separate disagreement that arises because of model error, lack of evidence in the register, or gaps in the taxonomy. The full preregistered protocol can be found here.
The extension
This approach could also be extended to link research activity to government policy priorities and research outputs. A joined-up view could help identify where research investments are addressing stated needs, where relevant evidence already exists, and where gaps remain.
If you run a research data infrastructure or are otherwise responsible for public transparency about the use of your data, I will build you live interactive dashboards tailored to your register and use cases.
In a typical 6-week engagement, you will receive a cleaned and structured register, a live searchable dashboard enriched with LLM-classifications against a documented taxonomy, and a validation plan.
Discuss a project: balint@balintstewart.co.ukI have nearly a decade of experience working in the sensitive data research infrastructure landscape, first at Administrative Data Research UK (ADR UK) and then at DARE UK. More recently I worked on building AI-powered tools for digital pathology, another high-stakes domain where evaluation is as important as raw model capability. I am currently working with UCL on HDR UK-funded research to develop and validate the DEA dashboard.